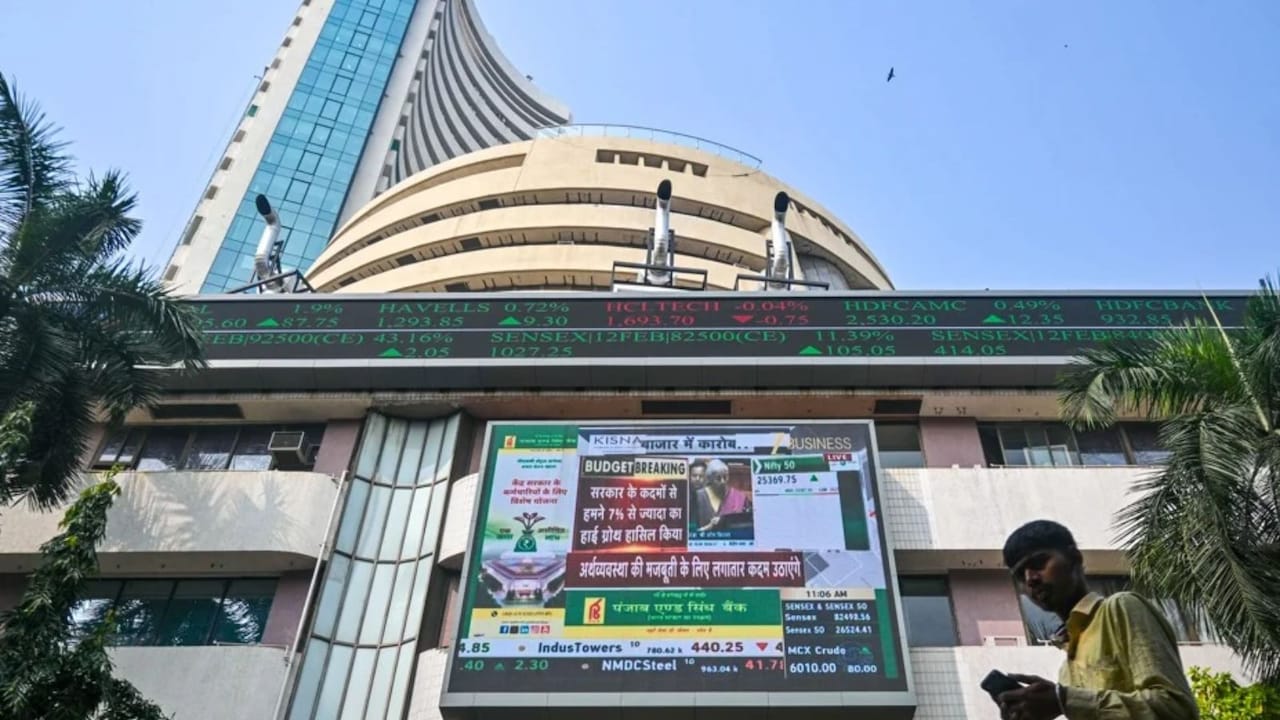
One Stock. Two Timeframes. A Breakout That Fooled the Crowd
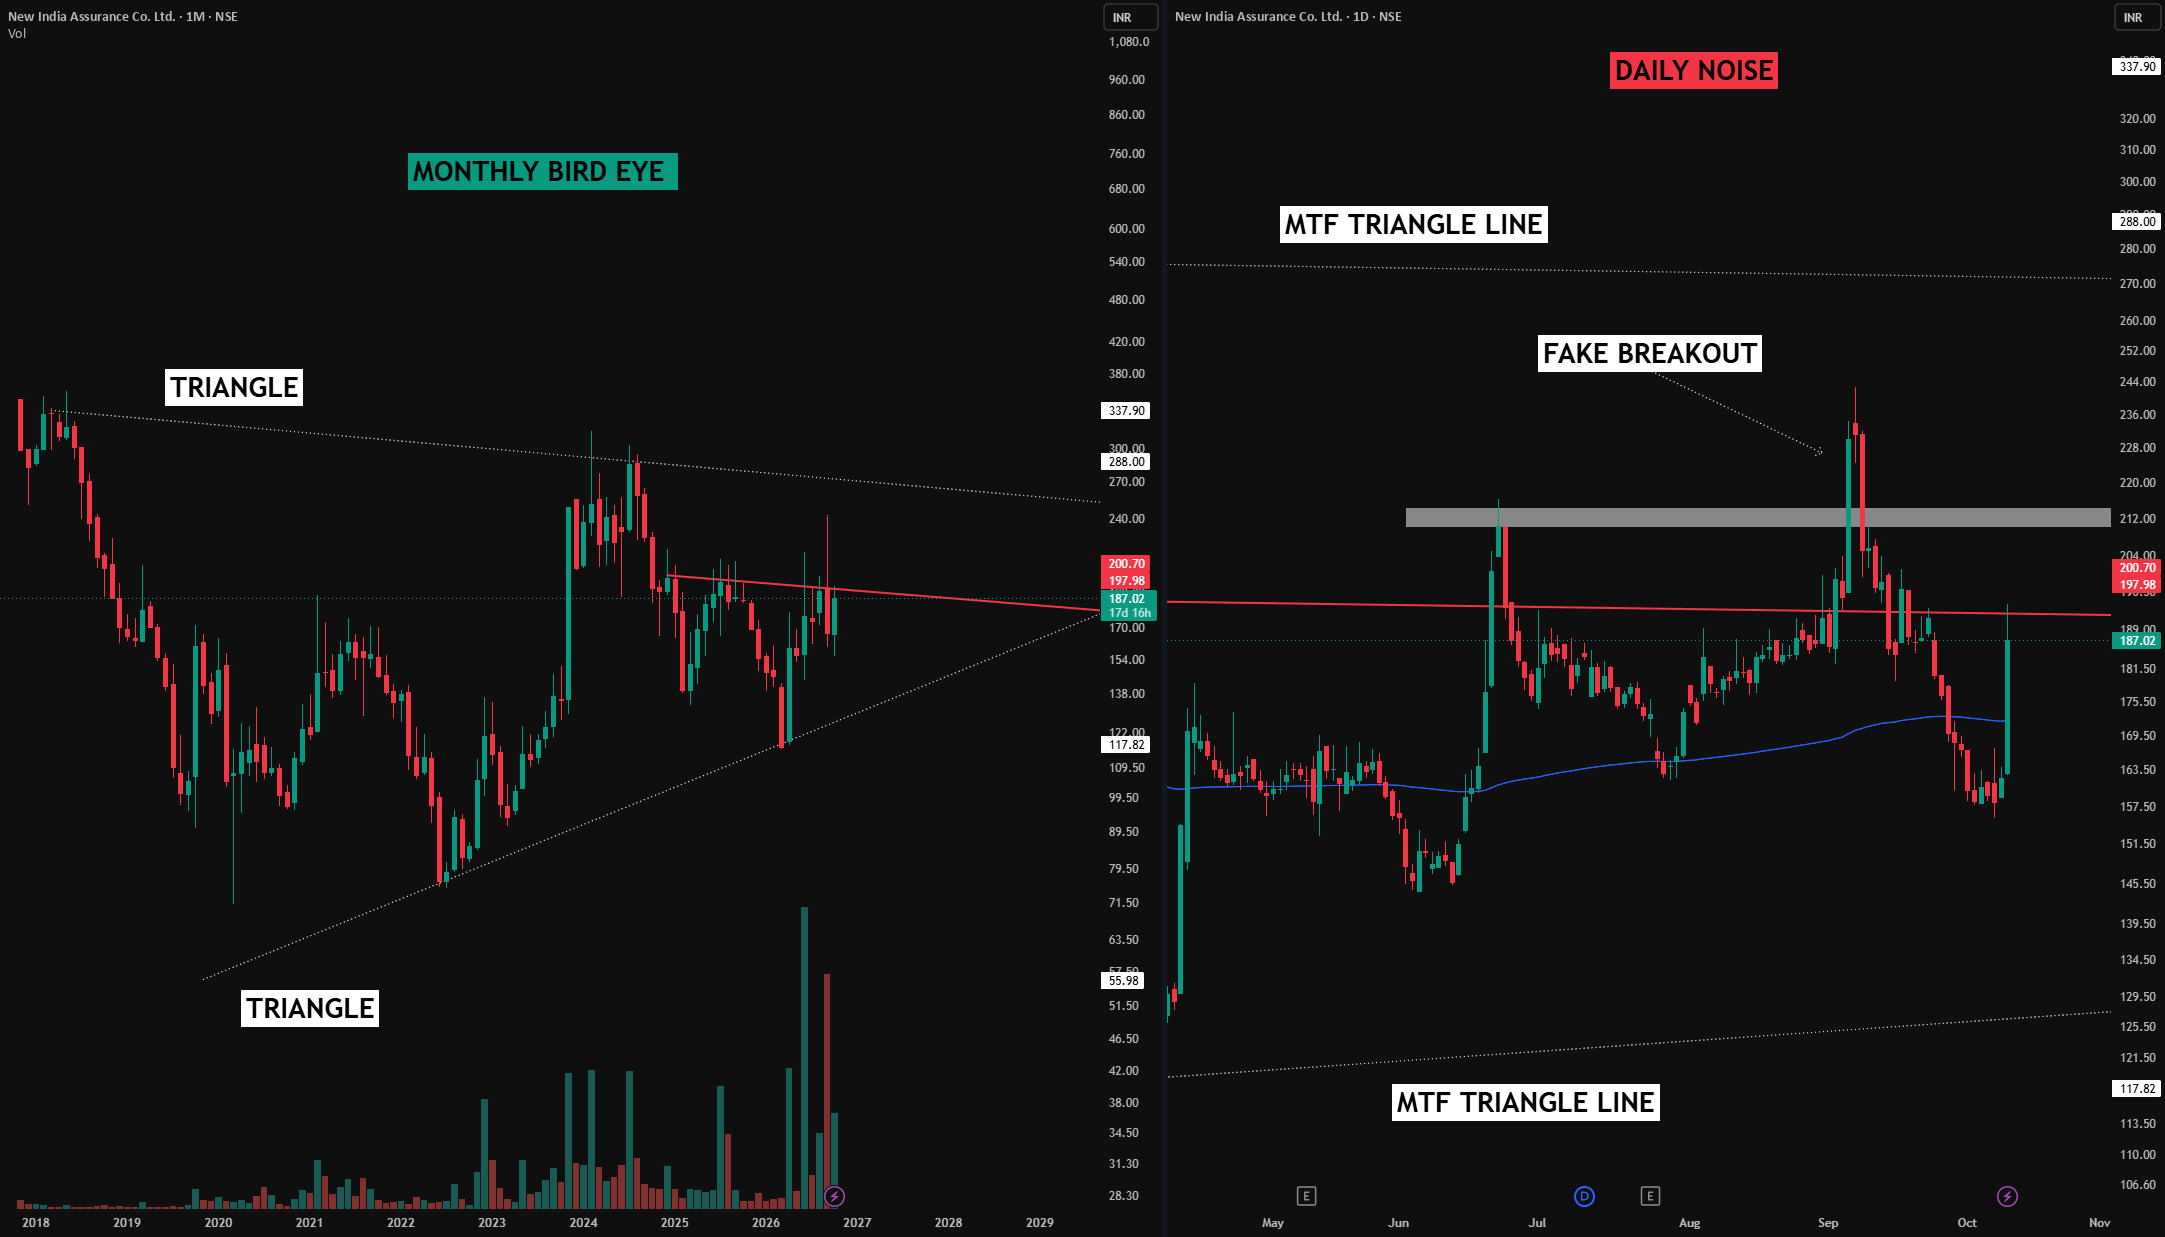
APOORV DUBEY | SEBI Registered Research Analyst A breakout is not always the opportunity. Sometimes, the location of that breakout is the real story. This chart of New India Assurance demonstrates why I believe multi-timeframe analysis is essential for understanding market structure and potential liquidity traps.
LEFT - MONTHLY TIMEFRAME (Bird's-Eye View) The broader chart reveals a large symmetrical triangle-like structure, with price operating between descending resistance and rising support. This higher-timeframe perspective provides context that a Daily chart alone may not reveal. RIGHT…
Read the full report on Tradingview
Story file
- Section
- Business
- Topics
- Stock market
- First reported by
- Tradingview
- Reporter
- apoorv-dubey sebi-ra follow following
- Published
- Tuesday, 13 October 2026, 12:29 am IST
- Coverage
- One outlet so far
How this page works. The Headline Update lists this report from Tradingview with a short summary and a link to the original. The original reporting and photograph belong to the publisher. Spotted an error in our summary? Tell our corrections desk.