Kotak Mahindra Bank – Daily Chart Analysis | Breakout Watch
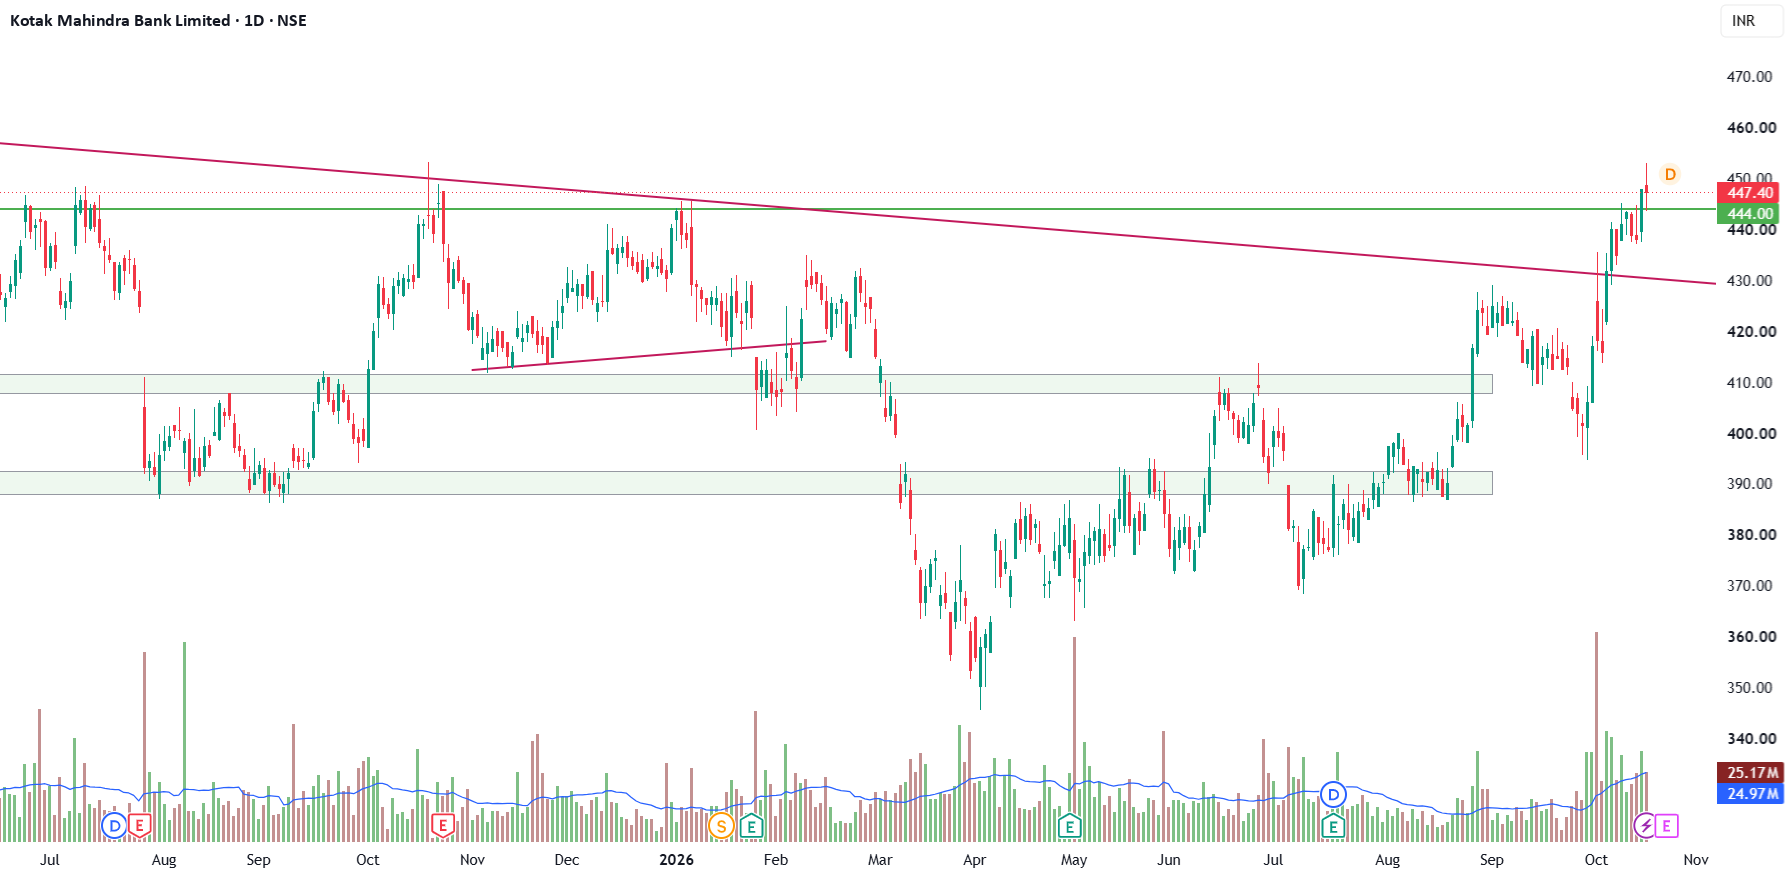
**Kotak Mahindra Bank – Daily Chart Analysis | Breakout Watch📈** Kotak Mahindra Bank is showing strong bullish momentum after breaking above a descending trendline and the resistance zone around ₹440–₹444. 🔍 **Key observations:** - **Trendline breakout:** Price has moved above the descending resistance trendline. - **Resistance breakout:** The stock is trading above the ₹444 level. - **Volume:** Recent price action shows increased trading volume, supporting the breakout. - **Next levels to watch:** ₹450 and above, subject to sustained buying momentum. - **Support levels:** ₹440–₹444, followed…
Read the full report on Tradingview
Story file
- Section
- Business
- Topics
- Cars & bikes
- First reported by
- Tradingview
- Reporter
- mr-nm
- Published
- Sunday, 18 October 2026, 7:27 am IST
- Coverage
- One outlet so far
How this page works. The Headline Update lists this report from Tradingview with a short summary and a link to the original. The original reporting and photograph belong to the publisher. Spotted an error in our summary? Tell our corrections desk.