Dr. Reddy's Laboratories | Elliott Wave Analysis
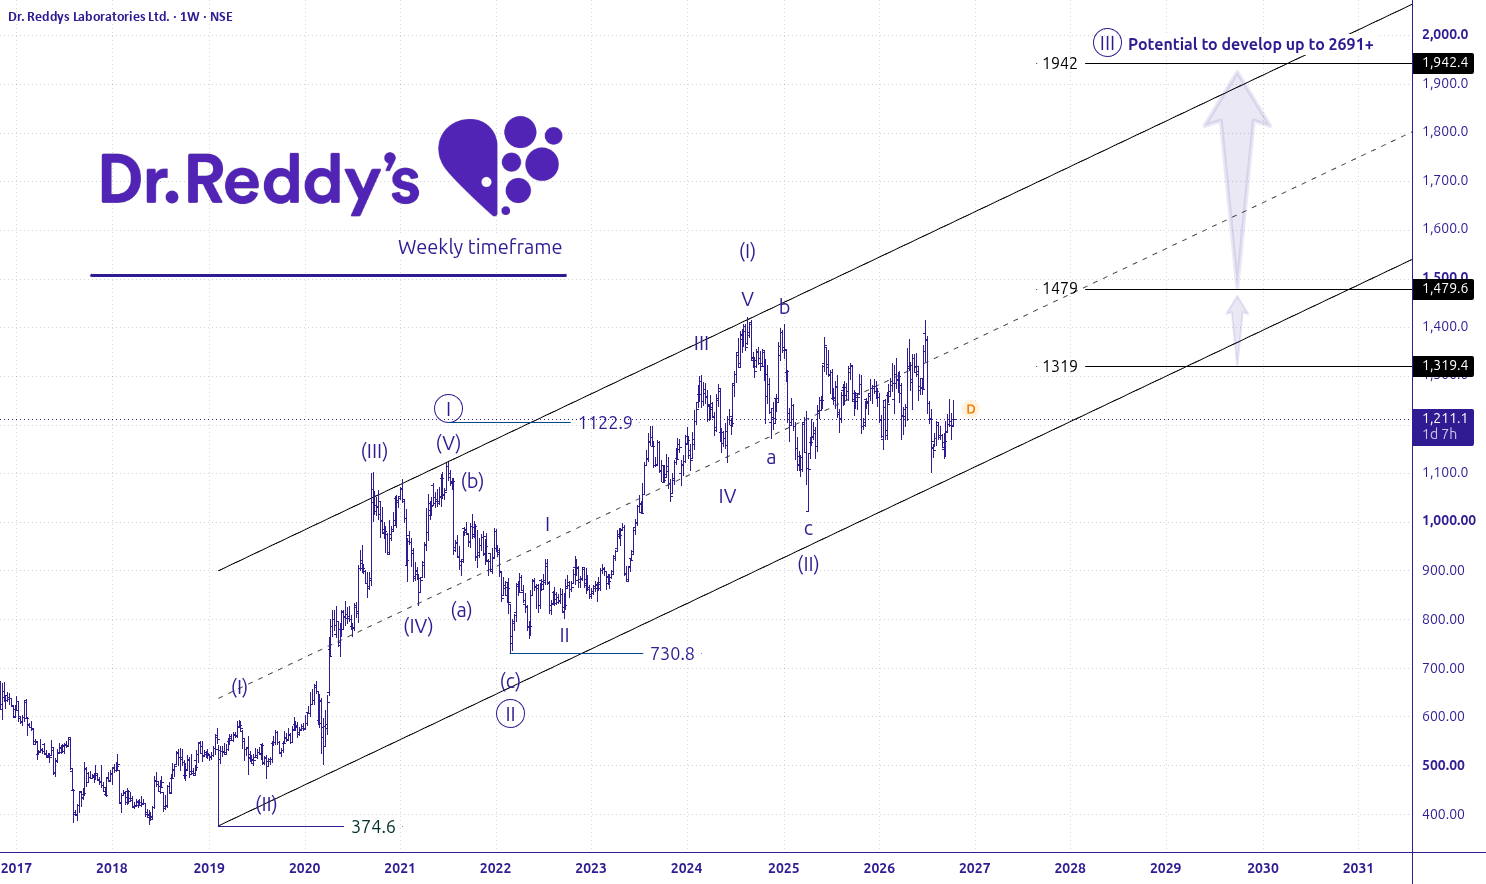
📈 Dr. Reddy's Laboratories | Weekly Chart | Elliott Wave Projection NSE:DRREDDY appears to be developing a long-term bullish Elliott Wave structure within a rising parallel channel. The advance from the 2022 low could represent the beginning of a larger upward move, with the potential for an extended Wave ((III)) . 🎯 Elliott Wave Price Projections - Near-Term Upside: 1319 → 1479 - Extended Target: 1942 - Bullish Extension Scenario: 2691+ if Wave (III) develops into an extended impulse. - Invalidation Level: 730 The 2691+ projection is a conditional, ambitious objective that could come into…
Read the full report on Tradingview
Story file
- Section
- India
- Topics
- Stock market
- First reported by
- Tradingview
- Reporter
- vcsompura follow following
- Published
- Thursday, 15 October 2026, 9:28 am IST
- Coverage
- One outlet so far
How this page works. The Headline Update lists this report from Tradingview with a short summary and a link to the original. The original reporting and photograph belong to the publisher. Spotted an error in our summary? Tell our corrections desk.

