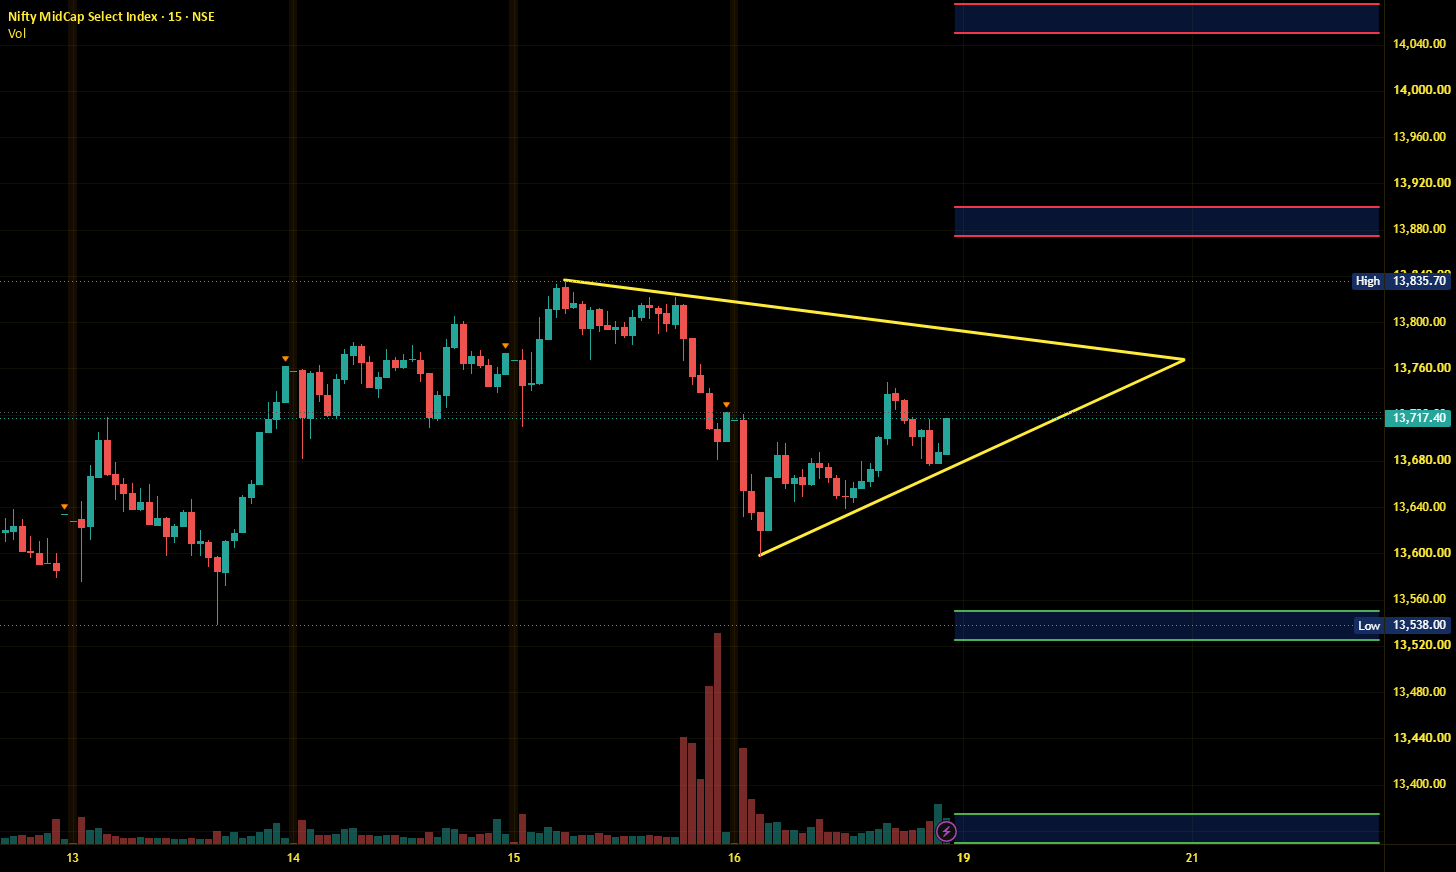
Bank Nifty's Channel Collision @ Macro Resistance
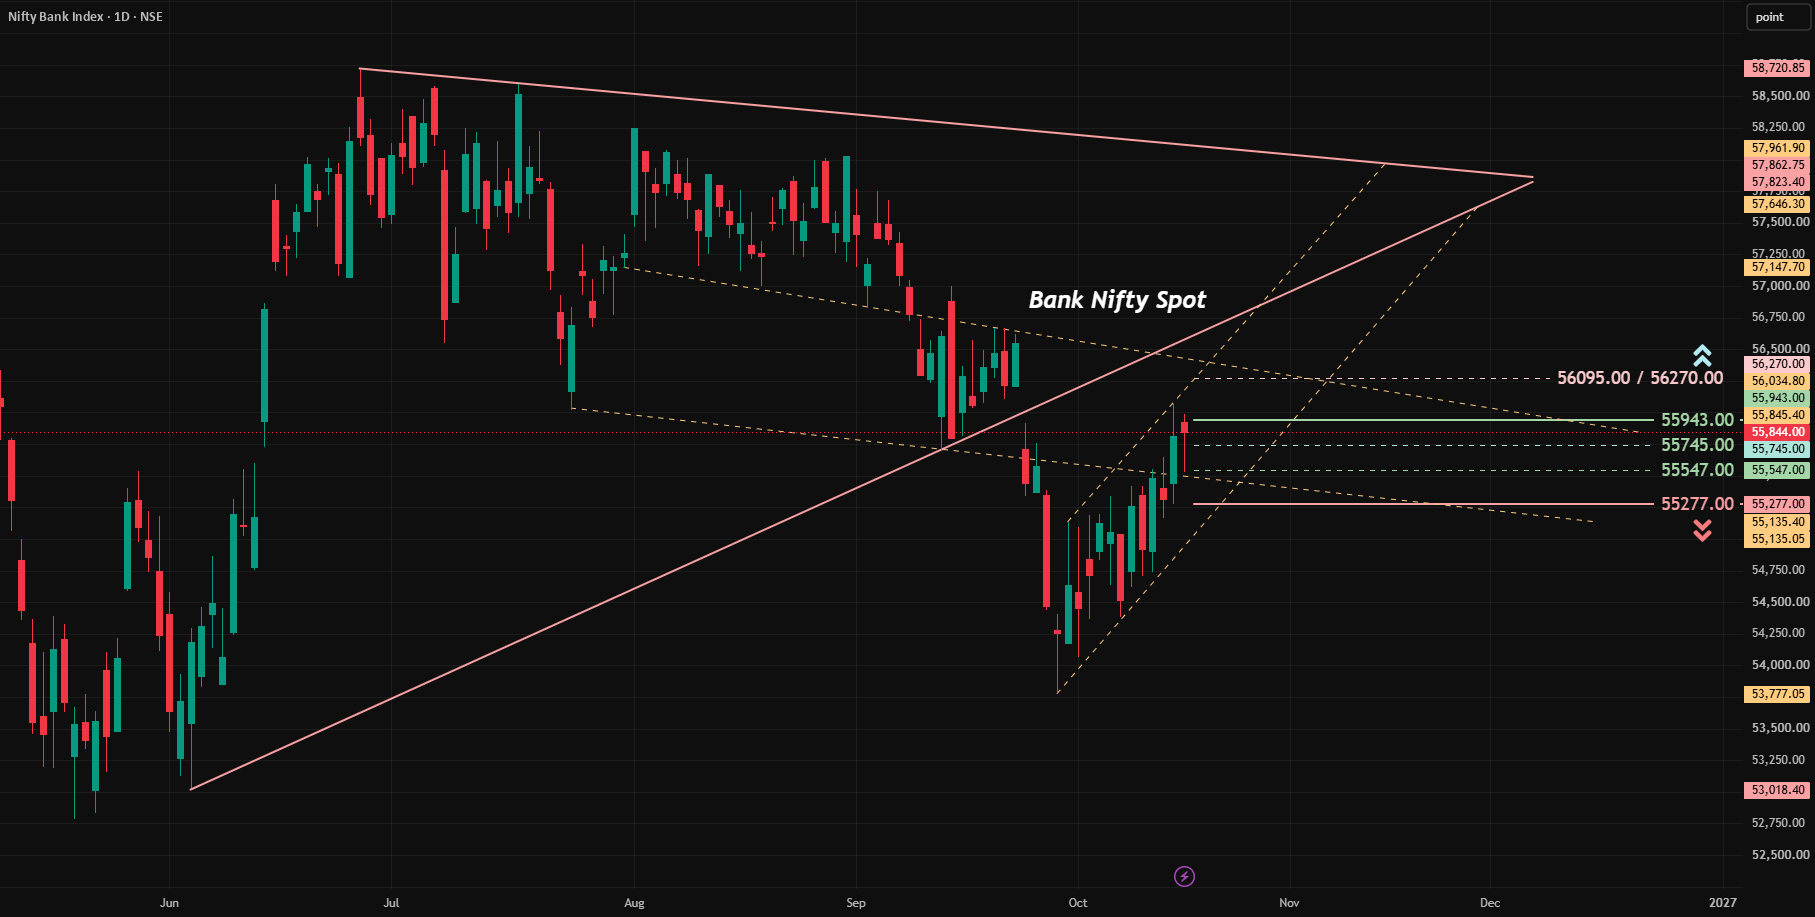
Macro Geometry: The chart features a large multi-month symmetrical triangle / contracting wedge pattern defined by the solid pink trendlines. Price broke below the primary ascending trendline support near 55,400–55,500, dropping sharply into an impulse down-leg. A secondary descending parallel channel (dashed yellow lines) captured the intermediate corrective decline, from which price has staged a V-shaped counter-trend recovery back toward the breakdown retest zone.
Technical ObservationsBreakdown Retest / Pullback Zone: The recent rally from the swing low is a counter-trend retracement…
Read the full report on Tradingview
Story file
- Section
- Business
- Topics
- Stock market
- First reported by
- Tradingview
- Reporter
- emraldconsul follow following
- Published
- Sunday, 18 October 2026, 6:29 pm IST
- Coverage
- One outlet so far
How this page works. The Headline Update lists this report from Tradingview with a short summary and a link to the original. The original reporting and photograph belong to the publisher. Spotted an error in our summary? Tell our corrections desk.